Python openCV 大津の二値化
大津の二値化こちらを動かしてみた。
より鮮明に2値画像を判別できるらしい
元画像が変なのでへんな結果。
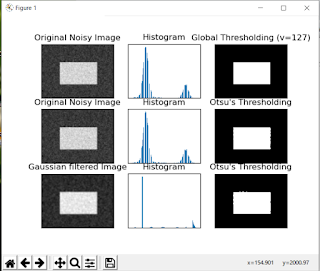
本当はこうなる

ヒストグラムに2つ山がないものにはあまり効かないみたい
コンピューターからはこんな感じで見えるのだろうか。人間の目は、黒が薄くなった灰色と白が暗くなった灰色を自動補正しているんだろうな。人間の目の補正機能は凄い

より鮮明に2値画像を判別できるらしい
import cv2
import numpy as np
from matplotlib import pyplot as plt

img = cv2.imread('pic2.png',0)

# global thresholding
ret1,th1 = cv2.threshold(img,127,255,cv2.THRESH_BINARY)

# Otsu's thresholding
ret2,th2 = cv2.threshold(img,0,255,cv2.THRESH_BINARY+cv2.THRESH_OTSU)

# Otsu's thresholding after Gaussian filtering
blur = cv2.GaussianBlur(img,(5,5),0)
ret3,th3 = cv2.threshold(blur,0,255,cv2.THRESH_BINARY+cv2.THRESH_OTSU)

# plot all the images and their histograms
images = [img, 0, th1,
          img, 0, th2,
          blur, 0, th3]
titles = ['Original Noisy Image','Histogram','Global Thresholding (v=127)',
          'Original Noisy Image','Histogram',"Otsu's Thresholding",
          'Gaussian filtered Image','Histogram',"Otsu's Thresholding"]

for i in range(3):
    plt.subplot(3,3,i*3+1),plt.imshow(images[i*3],'gray')
    plt.title(titles[i*3]), plt.xticks([]), plt.yticks([])
    plt.subplot(3,3,i*3+2),plt.hist(images[i*3].ravel(),256)
    plt.title(titles[i*3+1]), plt.xticks([]), plt.yticks([])
    plt.subplot(3,3,i*3+3),plt.imshow(images[i*3+2],'gray')
    plt.title(titles[i*3+2]), plt.xticks([]), plt.yticks([])
plt.show()
元画像が変なのでへんな結果。

本当はこうなる
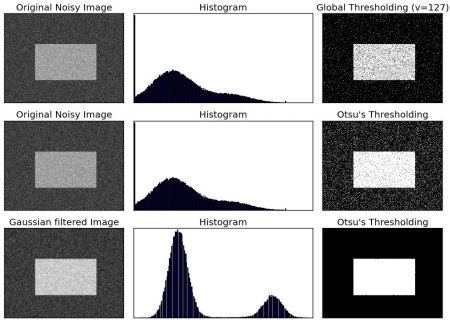
ヒストグラムに2つ山がないものにはあまり効かないみたい
コンピューターからはこんな感じで見えるのだろうか。人間の目は、黒が薄くなった灰色と白が暗くなった灰色を自動補正しているんだろうな。人間の目の補正機能は凄い

コメント
コメントを投稿